In modern agent development, standard system metrics like latency, token count, and cost are insufficient for understanding complex agent behavior. Inspecting individual traces provides deep insight but doesn’t scale to the millions of traces generated in a live environment. Signals provide a high-level monitoring solution to this problem by offering automated, behavioral scoring for agents in production:Documentation Index
Fetch the complete documentation index at: https://wb-21fd5541-signals-docs-1994.mintlify.app/llms.txt
Use this file to discover all available pages before exploring further.
- Automated scoring: Every incoming production trace is automatically processed and scored on common quality issues and errors.
- Infrastructure: Processing is powered by Coreweave compute and Coreweave GPUs for scalability across millions of traces.
- Gain behavioral insight: Move beyond simple system metrics to understand if your agent is hallucinating, failing to follow conversation patterns, or losing grounding in its evidence.
- Accelerate the research loop: Use the scores and failure analyses generated by signals to identify specific weaknesses, which you can use to research model improvement, data annotation, or reinforcement learning.
Available signals
W&B Weave offers monitors with built-in signals: preset scorers that evaluate production traces for common quality issues and errors out of the box, with no custom setup. Each built-in signal uses a benchmarked LLM prompt to classify traces and saves the results as comma-delimited tags representing the detected issues. Signals use a W&B Inference model to score traces, so no external API keys are required. W&B Weave provides 13 preset signals organized into two groups.Quality signals
Quality signals evaluate successful root-level traces for output quality and safety issues.| Signal | What it detects |
|---|---|
| Hallucination | Fabricated facts or claims that contradict the provided input context |
| Low quality | Responses with poor format, insufficient effort, or incomplete content |
| User frustration | Signs of user frustration such as repeated questions, negative sentiment, or complaints |
| Jailbreaking | Prompt injection and jailbreak attempts that try to bypass safety guidelines |
| NSFW | Explicit, violent, or otherwise inappropriate content in inputs or outputs |
| Lazy | Low-effort responses such as excessive brevity, refusals to help, or deferred work |
| Forgetful | Failure to use context from earlier in the conversation, ignoring previously stated facts or instructions |
Error signals
Error signals categorize failed traces by root cause to help you identify and resolve infrastructure and application issues.| Signal | What it detects |
|---|---|
| Network Error | DNS failures, timeouts, connection resets, and other connectivity issues |
| Ratelimited | HTTP 429 responses, quota exhaustion, and throttling from upstream APIs |
| Request Too Large | Requests exceeding size or token limits, such as context window exceeded |
| Bad Request | Client-side errors where the server rejected the request (4xx except 429) |
| Bad Response | Invalid, unexpected, or unusable responses from remote services (5xx) |
| Bug | Flaws in application code such as KeyError, TypeError, or logic errors |
How signals work
Each signal uses an LLM-as-a-judge approach to classify traces:- Trace selection: Quality signals evaluate successful root-level traces. Error signals evaluate failed traces. Child spans and intermediate calls are not scored.
- Prompt construction: Weave constructs a prompt that includes the trace metadata, inputs, outputs, exception details (if any), and the operation’s source code. The signal’s classifier prompt is appended with instructions for the specific issue to detect.
- LLM scoring: For each signal, a W&B Inference model performs a binary classification (whether that issue is present on the trace). Detected issues are returned as comma-delimited string tags (for example,
"Low-quality, User-frustration, Forgetful"). - Result storage: Results are stored as feedback on the Call object and are queryable from the Traces tab.
Enable signals from the Monitors page
To enable signals:- Navigate to wandb.ai and then open your Weave project.
- In the Weave project sidebar, select Monitors.
- At the top of the Monitors page, a row of suggested signal cards appears. Each card shows the signal name, a description, and an + Add signal button.
- To enable a single signal, select the + Add signal button on the signal card. The signal begins scoring new traces immediately.
- To enable multiple signals at once, select the + [X] more signals button. This opens a drawer that lists all available signals grouped by category.
- Select the signals you want to turn on, then select Add signals.
Manage active signals
To view or remove active signals:- From the Monitors page, select the Manage signals () button. This opens a drawer listing all currently active signals grouped by category.
- Hover over a signal and select the Remove signal () button to disable the signal.
Use built-in signals
See tagged traces in the Traces table
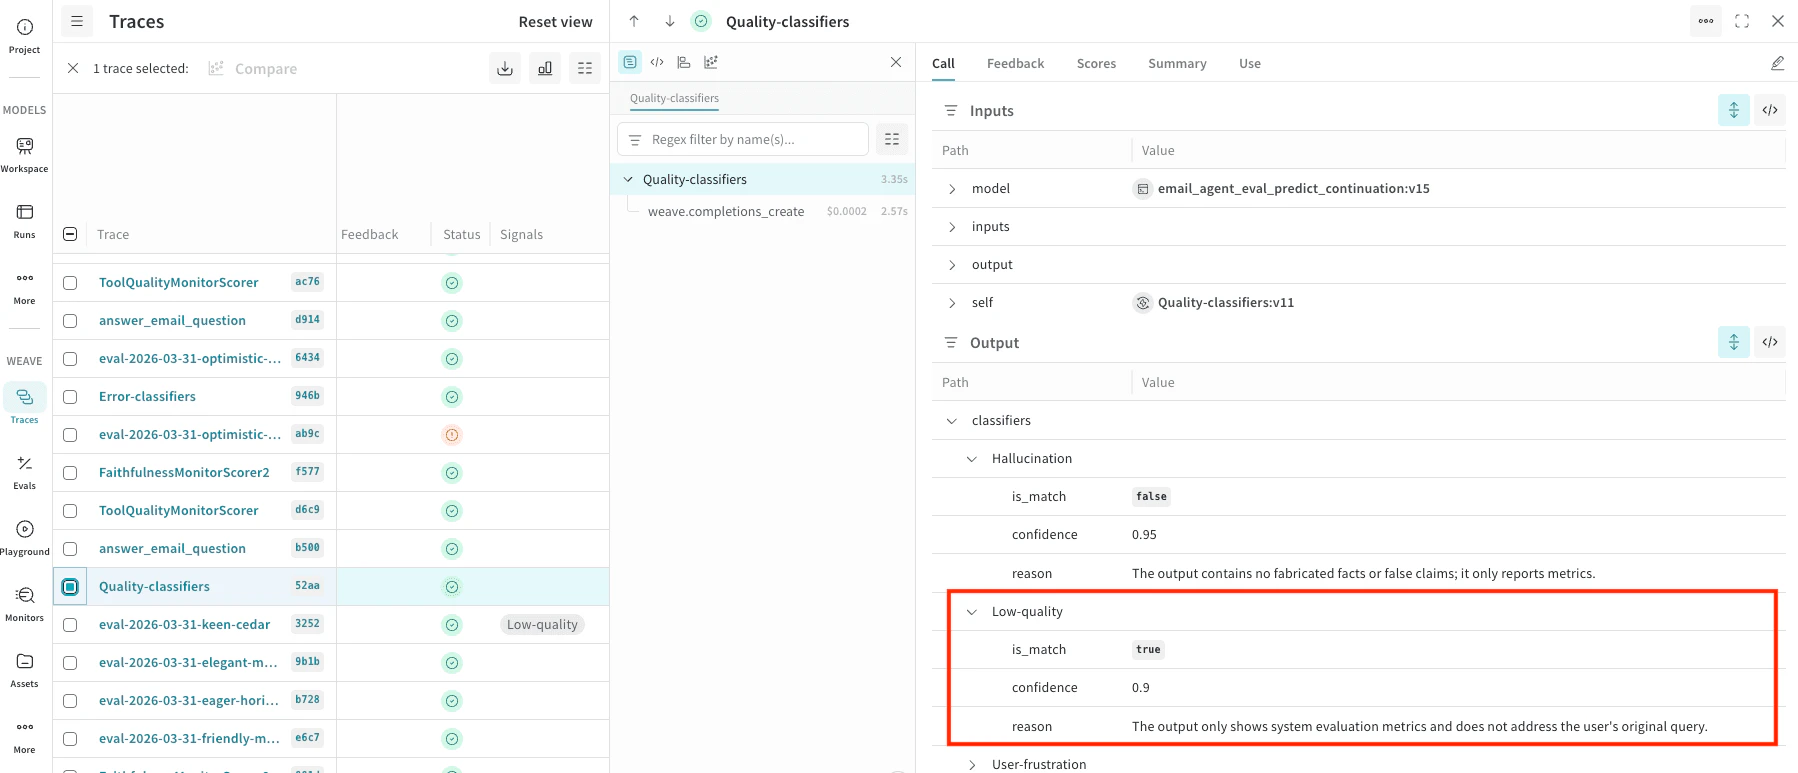
You can quickly scan your traces for certain behavior in the Traces tab using the Signals column. The Signals column is populated with tags when their criteria is met, and you can hover-over these tags to see the confidence in the score and the reasoning.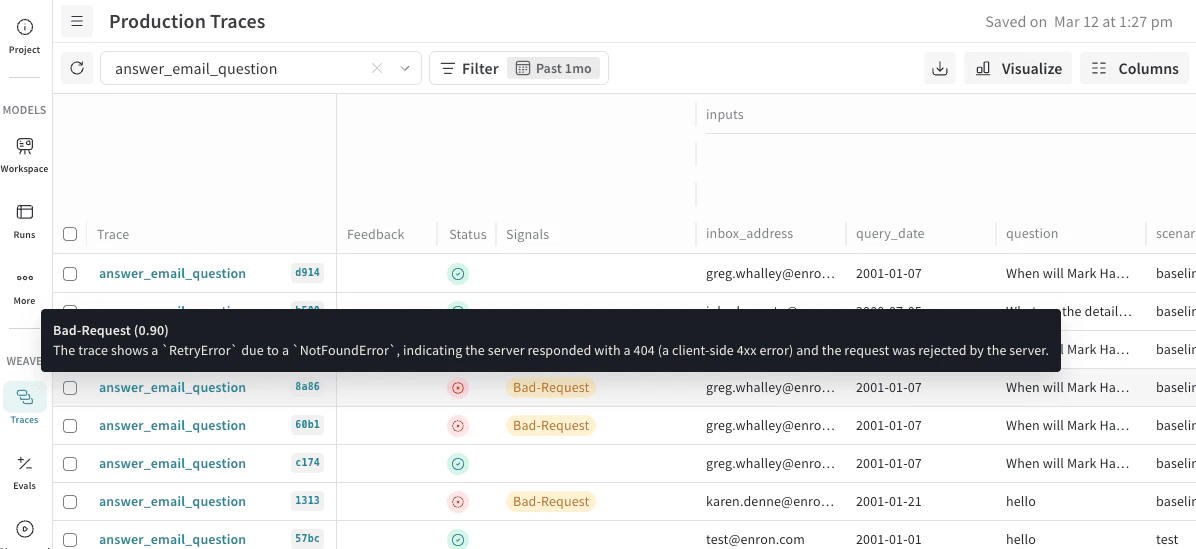
classifier_meta for the reasoning. For example, the following screenshot shows a Quality-classifiers signal with Low-quaility match and confidence (0.9) with a reason for this rating.
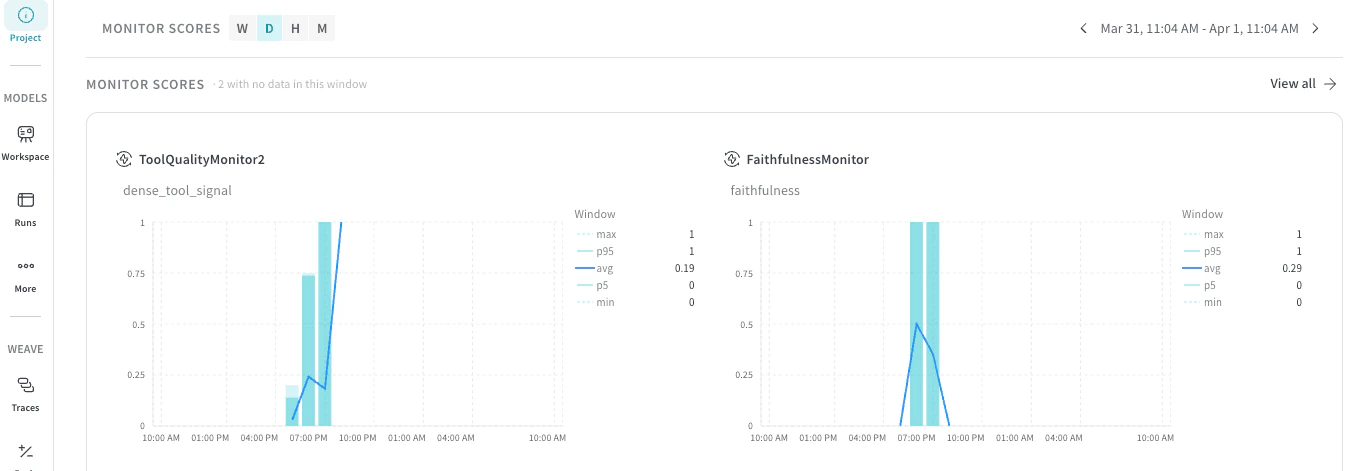
See signals in the project dashboard
You can also review signals at a project level:- In the project sidebar, select Project.
- At the top of the Project dashboard, select the Weave tab.
- In the Weave dashboard panels, locate Monitor Scores.
Alert on signals
You can set up automated triggers that notify your team through tools like Slack when an agent’s performance drops below a certain threshold. To get notified when a signal is triggered, set up an automation.For specific monitoring beyond what is provided by the built-in signals, see Set up custom monitors.